Review of the Li (Tsinghua) Pd/Deuterium Gas-transfer experiments and Storms' 2023 Paper
© Alan Fletcher 2023-2025
Review of Li v4 8/23/26Review of Storms v4 8/23/26
Proposal v2 4/11/24
Cell Details v2 4/12/24
Li Papers
The first half of this review has been updated in "Version 4". The second half discusses other details beyond this paper, and is not in V4.
1. Li/Tsinghua Papers and Results
Over several decades the group at Tsinghua University, China, conducted a series of LENR experiments, using gas-transfer of Deuterium through Palladium.2. Li et Al 2002
This version used a Palladium Tube.
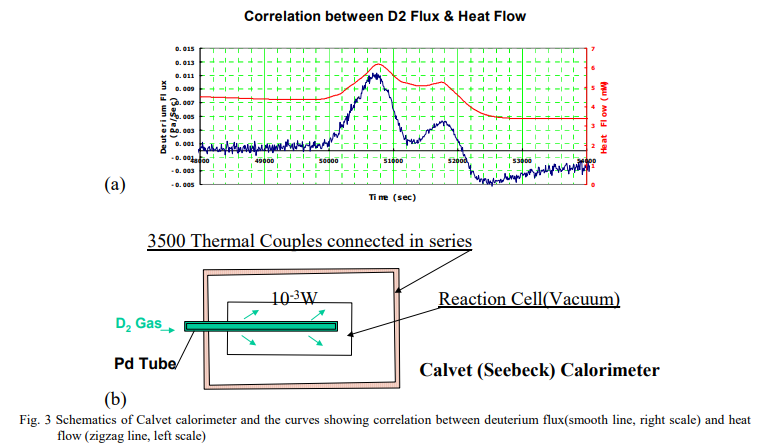
The 2002 cell is placed inside a commercial Calvet LV Calorimeter (Seebeck type, 1 uW sensitivity) and operated at internal temperatures between 20C and 200C (limited by the calorimeter).
The method of calculating Deuterium flux is not obvious.
3. Li et Al 2003
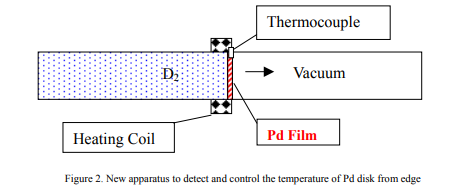
The new cell is made from a steel cylinder, with a disk of Palladium mounted in the middle.
- A steel cylinder
- A disk of untreated palladium film (foil)
- A "Deuterium room" containing 99.5% pure Deuterium at constant pressure.
- A "Vacuum room"
- A 50W DC heating resistor coil
- A Thermocouple near the edge of the disk
They also provide an "engineering sketch" of this version:
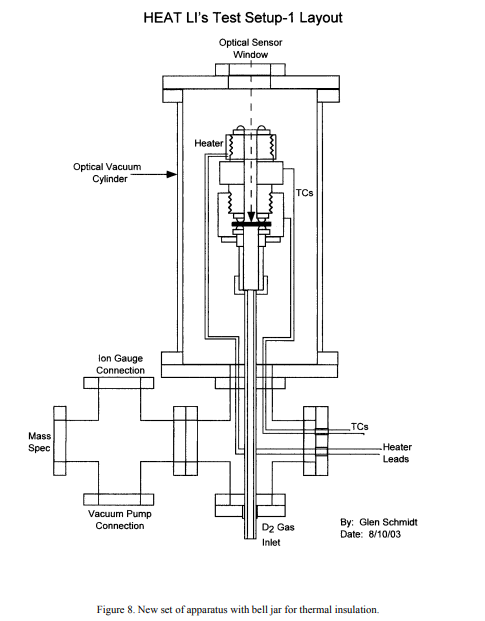
The design allows for a mass spectrometer, but this was probably not implemented.
The procedure for a run is as follows:
- Residual gases are cleared from the "D2" side by alternating a vacuum evacuation, and a refilling with D2 at atmospheric pressure several times.
- The vacuum is then connected permanently to the other side.
- The heater is turned on, and slowly ramped up to a maximum, and then ramped down again. The Deuterium on the "D2" side refills (at constant pressure?).
They report excess heat (left axis, red curve) of around 6 W for inputs (right axis, blue curve) of up to 25W
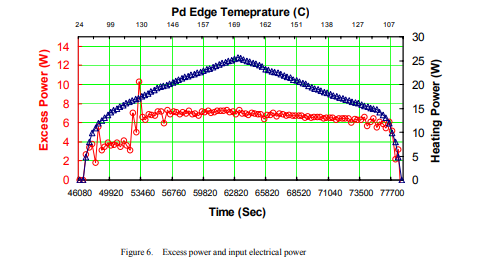
The Pd edge temperature is shown on the top axis.
They define a "transition temperature" Tr at which LENR ignites (but give no value!).
There actually appear to be two transitions, with excess power jumping to 4W at about 50C and a second step to 6W at 120C.
The excess power curve does NOT appear to folow an Arrhenus curve. (See below),
They seem to calculate the excess power by comparing a dummy run (copper foil) to an active run (Pd).
They refer to an optional vaccuum container, and note that the temperature rises to 400C.
The reported COP is low (COP 1.25).
They give the total number of Deuterium molcules passing through the system:
The total excess heat released in 9 hours was 192 kJ. Based on the total number of deuterium atoms permeating the Pd disk (2.6×10^20), we estimate the average energy released from each deuterium atom was 4.6 keV.
Me to chatGPT 4o: What is the weight of 2.6×10^20 deuterium molecules? What is the weight and volume of heavy water made from them?
G4:
- Mass of D₂ gas (2.6×10²⁰ molecules): ≈ 1.74 mg
- Heavy water (D₂O) formed:
- Mass: ≈ 5.75 mg
- Volume: ≈ 5.20 µL
The 2003 cell allows the (presumed) use of an infrared camera to observe the temperature of the disk, and not just the edge temperature. But they don't give the temperatures.
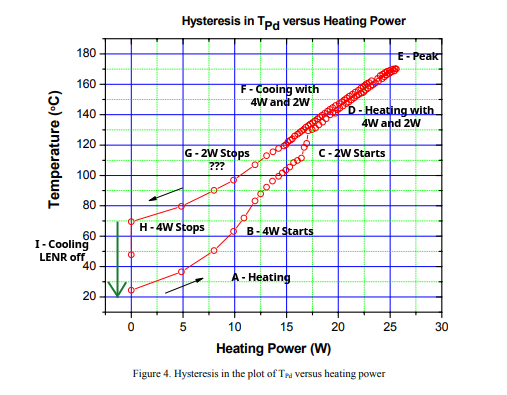
Fig 4 modified by AF.
A: Heating Stage
-- The system starts to heat up, following normal thermodynamics
B: 4W Excess Heat Starts
-- At about 10W 60C - excess heat starts to be generated, at about 4W
C: 2W Excess Heat Starts
-- At 14W 110C a second stage of excess heat starts, at about 2W (6W total)
D: Continues heating with 2w and 4W
E: Peak Temperature.
-- This continues to 25W 170C after which the Heater power is ramped down
F: Cooling stage, LENR active
-- while both LENR sources are active the temperature decreases smoothly.
G: 2W Excess Heat Stops
-- at about 12W 110C the 2W source SHOULD cut off
-- The 6W source continues to generate heat so the temperature does not fall towards ambient
H: 4W Excess Heat Stops
- The temperature reaches 70C -- at which the 6W source cuts off
I: Cooling, LENR off
-- with no LENR the system contines to cool down to ambient 20C
The following two effects are noted, but are not analyzed further.
4. Liu et al 2014
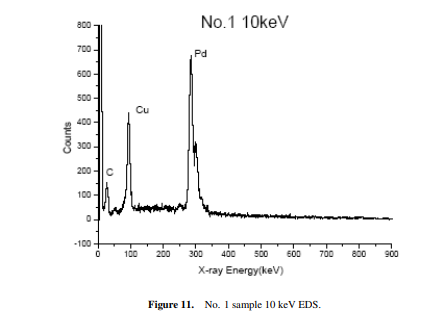
The 2014 experiment used a different cell and no calorimetry. After a series of runs (over 80 in one case), they performed molecular spectroscopy on the film, and detected Copper and other elements. This experiment used much higher pressure D2 (4Mpa, 40 bar, 600 psi).
5. Reported temperature anomaly
Li et al report an anomalous behavior in the output temperature:
Based on Storms, this probably represents a change in the Deuterium diffusion rate
Chen 2022 : Hydrogen permeation in a palladium membrane tube: Impacts of outlet and vacuum degree
This gives the diffusion rate for a specific temperature as (re-arranged):
atoms/sec = K1 * (Area/Length) * (sqrt(P1)-sqrt(P2));
In this case P2 is vacuum, approximated by 0, and P1 is constant 1 Bar
However, K1 is temperature-dependent, based on the Arrhenius equation
K1 = K2 * exp(-K3 / k T)
So far so good.
Suzuki 2020: Analysis for Reverse Temperature Dependence of Hydrogen Permeability through Pd-X
also shows a peak, for Hydrogen, at around 100C (solid black circles in fig 2a)
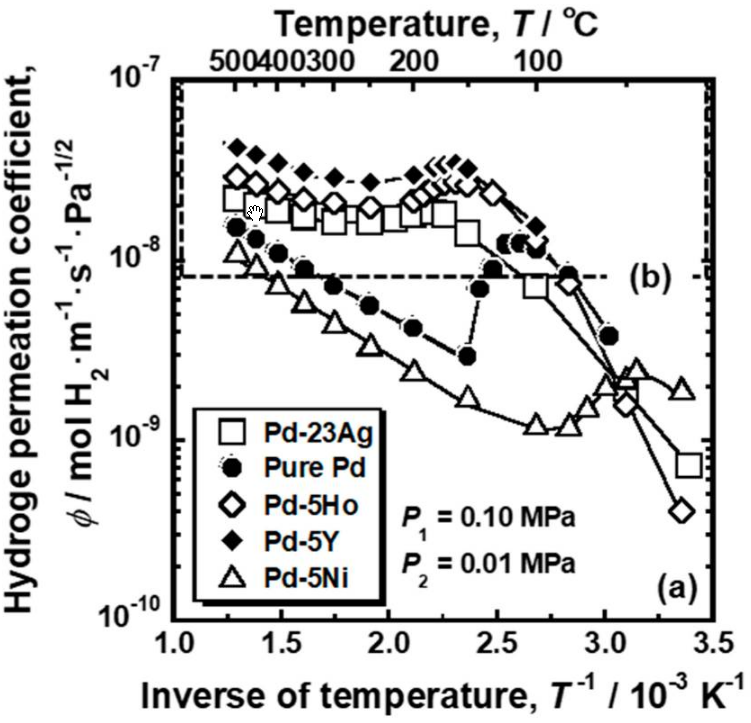
"However, Suzuki et al. have recently reported that the Pd-Ag alloy membranes exhibit reverse temperature dependence of hydrogen permeability below 250 °C ."
It seems to me that Li et al discovered this effect in 2003!
These curves are for Hydrogen: Deuterium has different permeability (higher, ISTR).
In this paper Li says there is a peak of 180C (?) at the edge of the disk.
LENR experiments at higher temperatures won't see this effect.
Li and Suzuki have theoretical explanations, but I haven't followed that.
2007 : Cantwell -- inconclusive replication attempt